Assessment
Measure it. Understand it. Improve it.
Assessment provides evidence against an agreed standard; evaluation interprets that evidence and decides what to change.
Types of evidence
Direct and indirect evidence
Direct
What learners produce
Exams, projects, lab reports, presentations and portfolios, scored against criteria tied to specific outcomes. Direct evidence carries most of the weight in attainment.
Indirect
What people report
Course exit surveys, alumni and employer feedback. Useful for context and triangulation; in many methods it is blended in with a smaller weight.
Rubrics
Make the standard visible before the task
Illustrative rubric: decision brief for the sales-data task
Accurate analysis
- Developing
- Errors affect conclusions
- Proficient
- Minor errors, conclusions hold
- Exemplary
- Accurate and appropriately checked
Reasoned recommendation
- Developing
- Recommendation not linked to data
- Proficient
- Linked to some evidence
- Exemplary
- Justified with clear, relevant evidence
Responsible data handling
- Developing
- Personal data exposed or misused
- Proficient
- Mostly de-identified
- Exemplary
- De-identified and limitations stated
Clear explanation
- Developing
- Hard for the owner to follow
- Proficient
- Understandable with effort
- Exemplary
- Clear for a non-specialist reader
| Criterion | Developing | Proficient | Exemplary |
|---|---|---|---|
| Accurate analysis | Errors affect conclusions | Minor errors, conclusions hold | Accurate and appropriately checked |
| Reasoned recommendation | Recommendation not linked to data | Linked to some evidence | Justified with clear, relevant evidence |
| Responsible data handling | Personal data exposed or misused | Mostly de-identified | De-identified and limitations stated |
| Clear explanation | Hard for the owner to follow | Understandable with effort | Clear for a non-specialist reader |
Criteria from the workshop case study in the supplied presentation; level descriptors are illustrative.
Attainment methods
Threshold, target and level
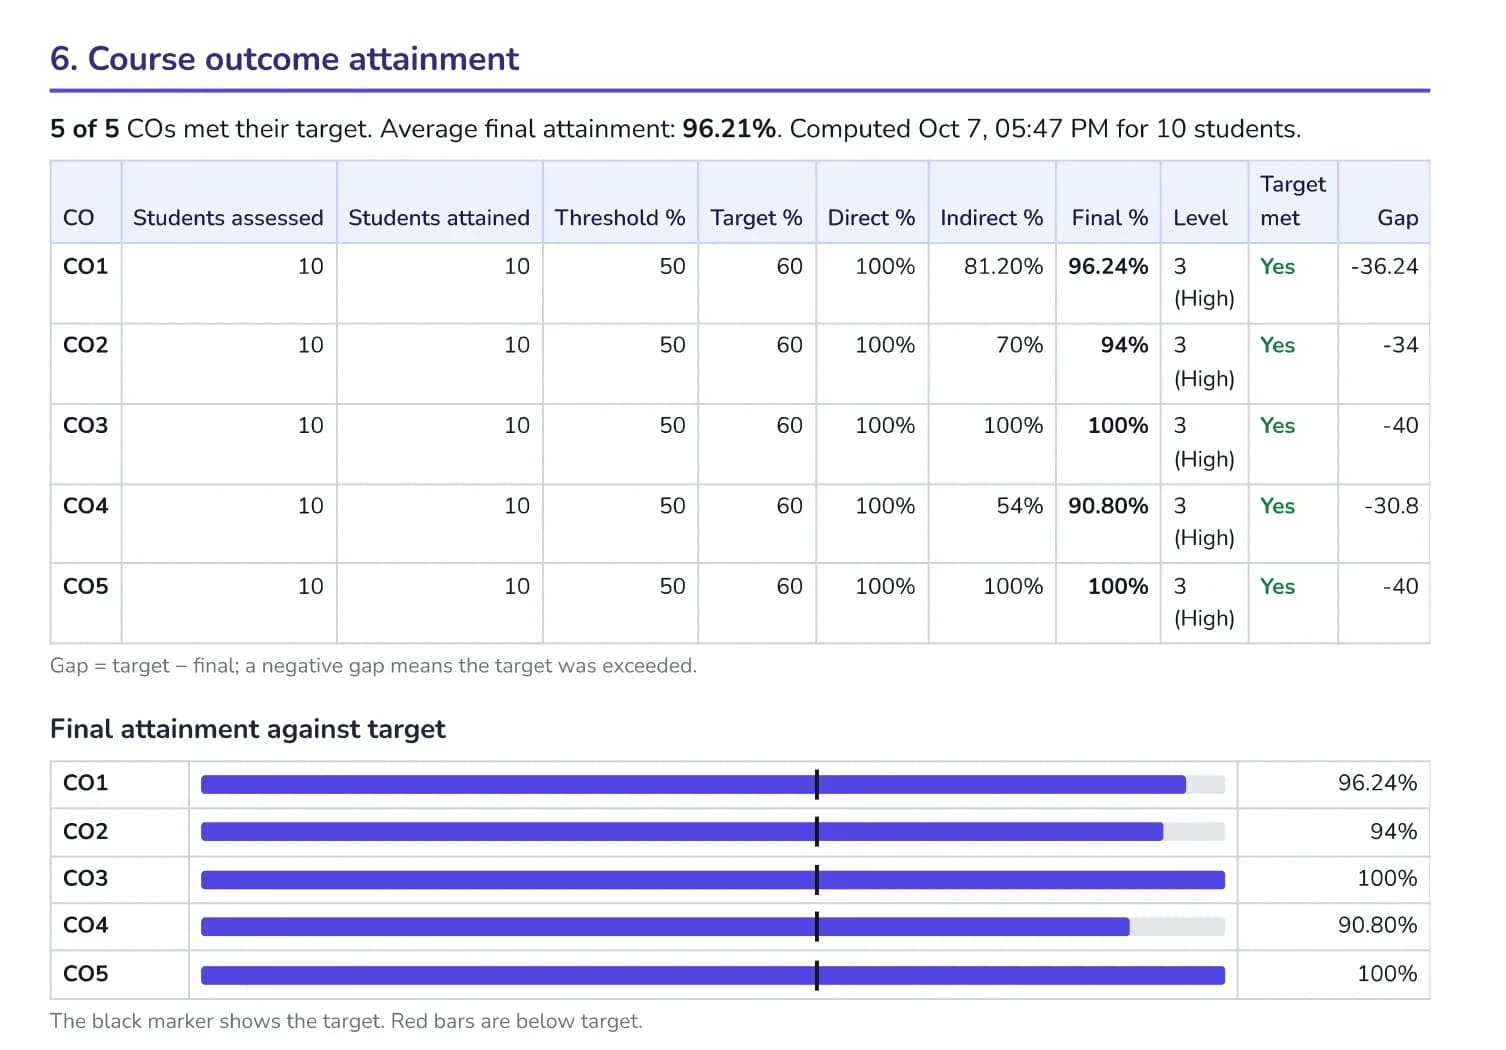
Threshold: the score a student needs on a course outcome to count as having attained it. Target: the share of students you aim to reach that threshold.
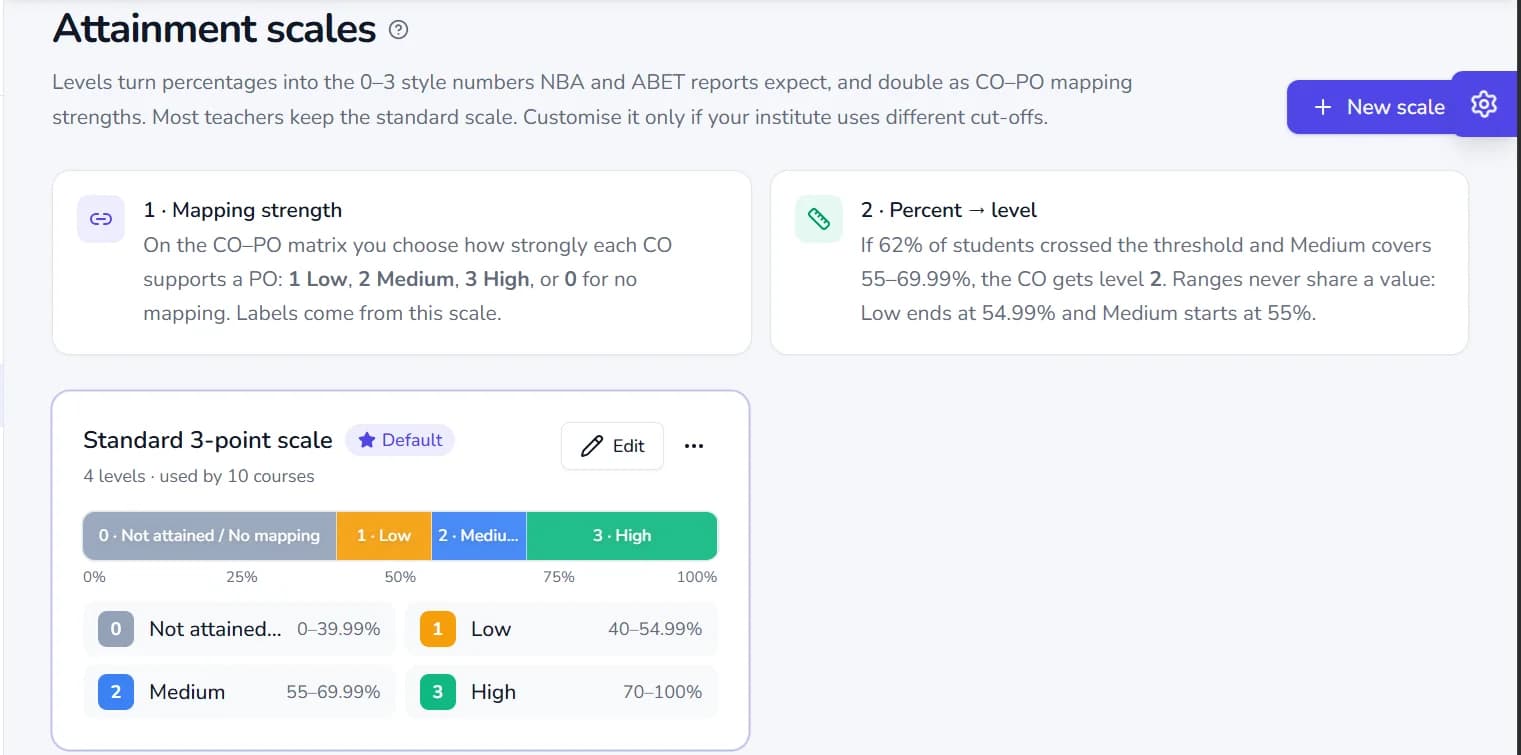
The share of students who reach the threshold becomes the CO’s attainment percentage. A scale then converts the percentage into a level (for example 0 to 3), which can be compared across courses and rolled up to program outcomes.
- Student CO % = marks obtained on every item tagged to the CO ÷ maximum marks of those items, across all assessments.
- A student attains the CO when Student CO % ≥ CO threshold.
- Direct CO attainment % = students attained ÷ students assessed × 100.
- Final % = 80% direct + 20% indirect (course exit survey: average rating ÷ rating scale maximum × 100).
- Level = the scale level whose range contains Final %. The CO meets its target when Final % ≥ Target %.
- PO attainment = Σ(CO level × mapping strength) ÷ Σ mapping strength over the COs mapped to the PO.
Interactive example
Work through a course outcome’s attainment
Change the inputs to see how direct and indirect evidence combine into a level. This follows the method in OBE Studio’s sample course file and is illustrative; use your institution’s approved policy for real decisions.
Result
57.20%
Final attainment
- Direct
- 21 ÷ 40 × 100 = 52.50%
- Indirect
- 3.8 ÷ 5 × 100 = 76.00%
- Final
- 80% × 52.50 + 20% × 76.00
- Gap to target
- 2.80 points short
Scale used
- L0 0–39.99%
- L1 40–54.99%
- L2 55–69.99%
- L3 70–100%
Reviewing results
Locate the gap before choosing the fix
In the workshop case, learners calculate accurately but struggle to justify the decision. A sensible response is an annotated exemplar and a feedback clinic, followed by a comparable task to see whether the change helped.
Closing the loop
Evidence is useful when it leads to a documented response
- 01 Map outcomesConnect outcomes with tasks and rubrics.
- 02 Measure attainmentReview assessed work against criteria.
- 03 Identify gapsLocate the skill and learners needing support.
- 04 Guide improvementChange teaching, then reassess.
- Closed loop: back to 01


A closed loop records the action, the owner and the evidence of its effect.

Adapted from the OBE workshop deck. Reference: CMO No. 46, s. 2012, QA cycle.
Who reviews what
Clear ownership keeps the loop working at every level.
| Owner | Evidence to review | Decision |
|---|---|---|
| Faculty | Task results and rubric patterns | Feedback and teaching adjustment |
| Chair / dean | Outcome gaps across courses | Curriculum or faculty support |
| VPAA / QA | Improvement actions and trends | Standards and resource priorities |
| President / governing body | Institutional learning priorities | Sustained capacity and oversight |
Suggested rhythm: during the course, each term, and at scheduled institutional QA reviews. These roles are recommendations, not a CHED-mandated reporting table. Adapt them to local governance.
See the evidence record in OBE StudioContinue the guide
Turn this into practice today.
Map outcomes, plan assessments and see CO and PO attainment in OBE Studio. Free to start.