Outcomes
The promise your program makes, made measurable.
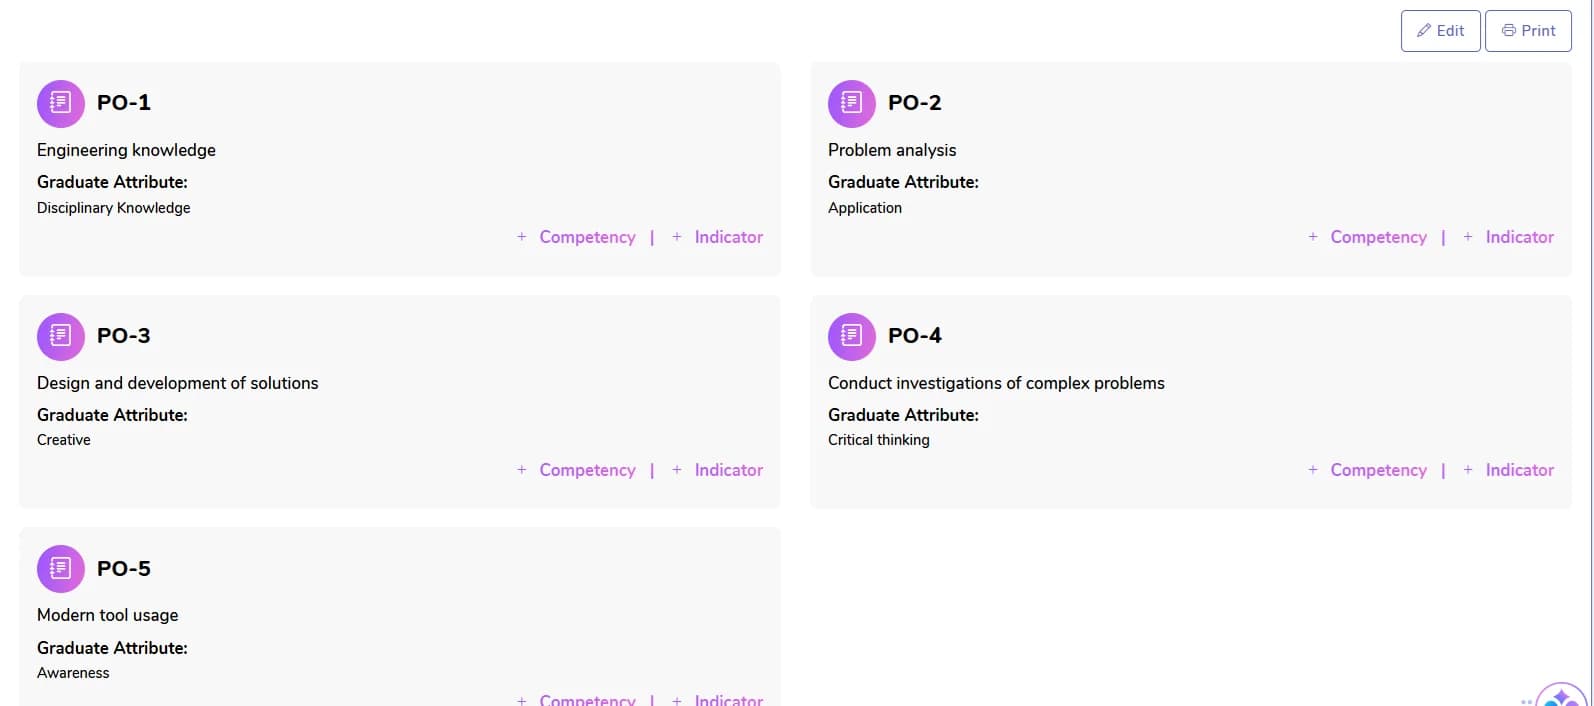
Program outcomes (POs) state the capabilities every graduate of a program should be able to demonstrate at graduation.
Definition and structure
The promise a program makes about its graduates
Program outcomes sit between the institution’s mission and the individual course. They translate the graduate attributes an institution commits to into capabilities specific enough to assess.
Most programs keep a short, stable list of POs, often drawn from their policies, standards and guidelines (PSG) or accreditation criteria, and review it on a planned cycle rather than every term.
In the CHED framework
Program outcomes sit at the heart of the chain.

- Vision
- Mission

- PEO 1, PEO 2, PEO 3
- PO 1, PO 2 … PO nalso called PLOs

- Course A: CLO 1, CLO 2 … CLO n
- Course A: Assessment 1, Assessment 2 … Assessment nEvery assessment is tagged with COs and cognitive levels
Vision → PEOs → PLOs → CLOs → Assessment: every assessment maps to outcomes.

Adapted from the OBE workshop deck. Reference: CHED OBE framework. Labels vary slightly between program PSGs.
PEOs, POs and PSOs
Three program-level statements, three time frames
| Statement | Describes achievement… | Illustrative example |
|---|---|---|
| Program educational objectives (PEOs) | A few years after graduation | “Graduates advance into analyst or supervisory roles in local enterprises.” |
| Program outcomes (POs) | At graduation | “Analyze complex problems using appropriate data and methods.” |
| Program-specific outcomes (PSOs) | At graduation, discipline-specific | “Build data dashboards that support small-business decisions.” |
PEOs relate to later graduate achievements, distinct from outcomes at graduation. Not every PSG uses PSOs.
Courses and assessment
How courses provide evidence for POs
PO attainment is then built up from the course outcomes mapped to it, typically a weighted average of CO attainment levels, using mapping strength as the weight.
Illustrative curriculum map: business analytics program
Business statistics
- PO1 · 3 High
- PO2 · 2 Medium
- PO5 · 1 Low
Data analytics
- PO1 · 2 Medium
- PO2 · 3 High
- PO3 · 1 Low
- PO4 · 2 Medium
- PO5 · 3 High
Business communication
- PO3 · 3 High
- PO4 · 1 Low
Capstone project
- PO1 · 2 Medium
- PO2 · 3 High
- PO3 · 3 High
- PO4 · 2 Medium
- PO5 · 2 Medium
| Course | PO1 | PO2 | PO3 | PO4 | PO5 |
|---|---|---|---|---|---|
| Business statistics | 3 High | 2 Medium | – | – | 1 Low |
| Data analytics | 2 Medium | 3 High | 1 Low | 2 Medium | 3 High |
| Business communication | – | – | 3 High | 1 Low | – |
| Capstone project | 2 Medium | 3 High | 3 High | 2 Medium | 2 Medium |
Sample data. Scale: 1 low, 2 medium, 3 high, – no mapping. Note that each course maps only where it genuinely contributes.
Continue the guide
Turn this into practice today.
Map outcomes, plan assessments and see CO and PO attainment in OBE Studio. Free to start.