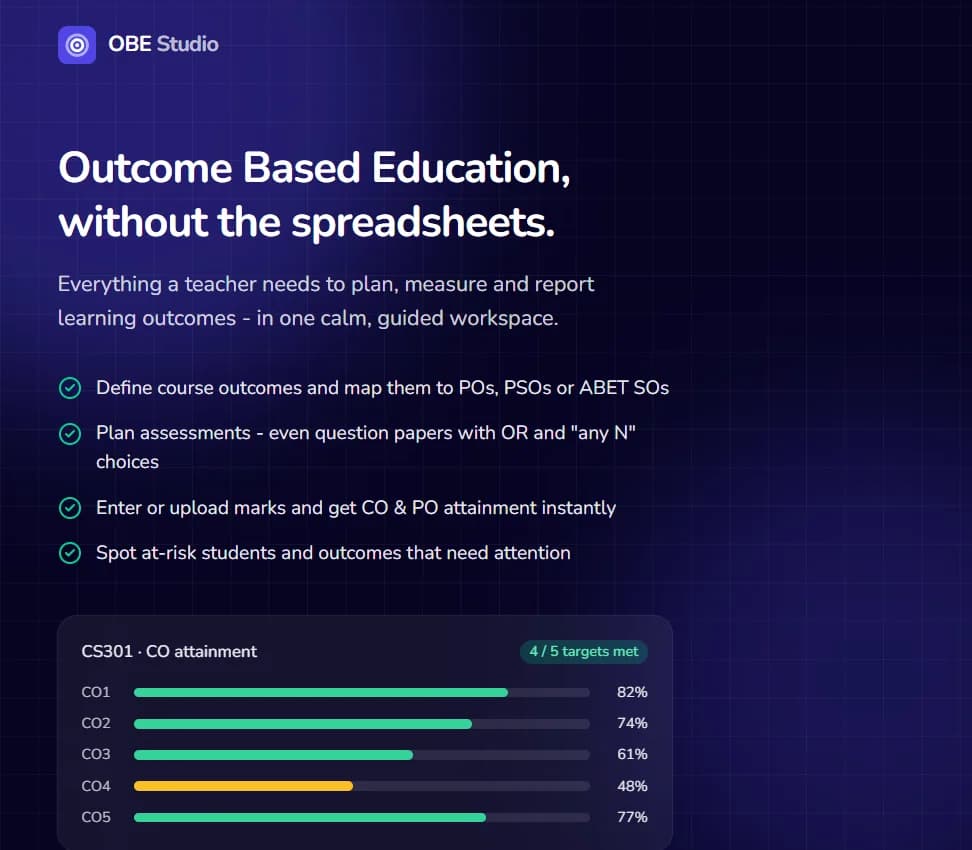
Product tour
Every outcome. Every assessment. One workspace.
OBE Studio turns the CHED outcome chain into a guided, term-by-term workflow, so faculty spend their time on teaching decisions, not spreadsheets.
Start here
Your whole teaching load, on one screen.
The workflow
From outcome to evidence in eight steps
- 1Step 1 of 8
Define course outcomes
Start with what learners will be able to do.
Write four to six measurable course outcomes (or paste them from your syllabus) and tag each with its Bloom’s level so the cognitive demand is visible at a glance.
Puts into practice: The Handbook’s outcome cascade
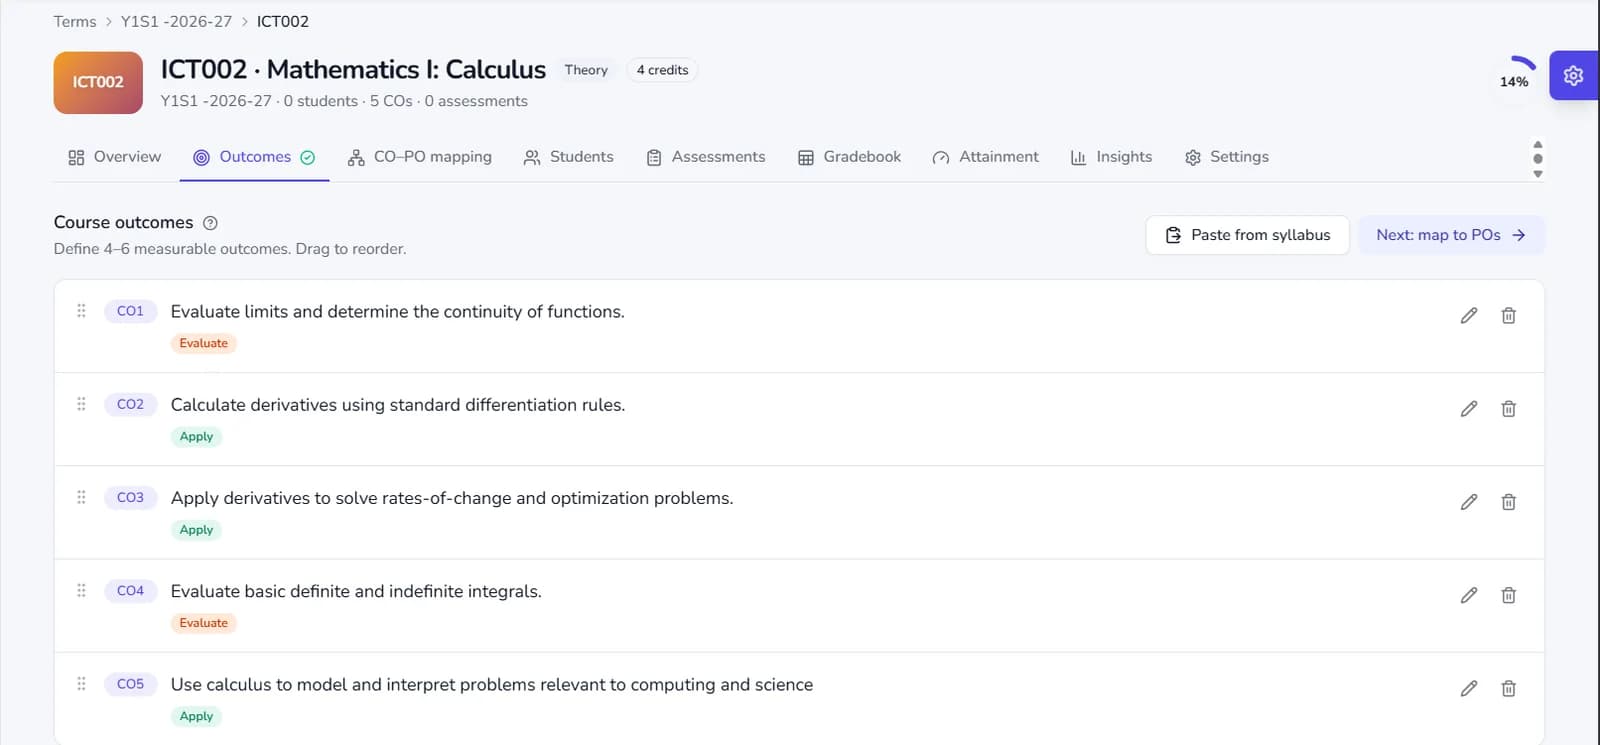
Course outcomes with Bloom’s levels, and “Paste from syllabus”. - 2Step 2 of 8
Map COs to program outcomes
Show exactly how each course builds the program.
Rate every CO–PO link 1, 2 or 3 with a click. Average strength per PO shows at once where a program outcome is well supported and where it hangs on a single weak link.
Puts into practice: CO–PO alignment
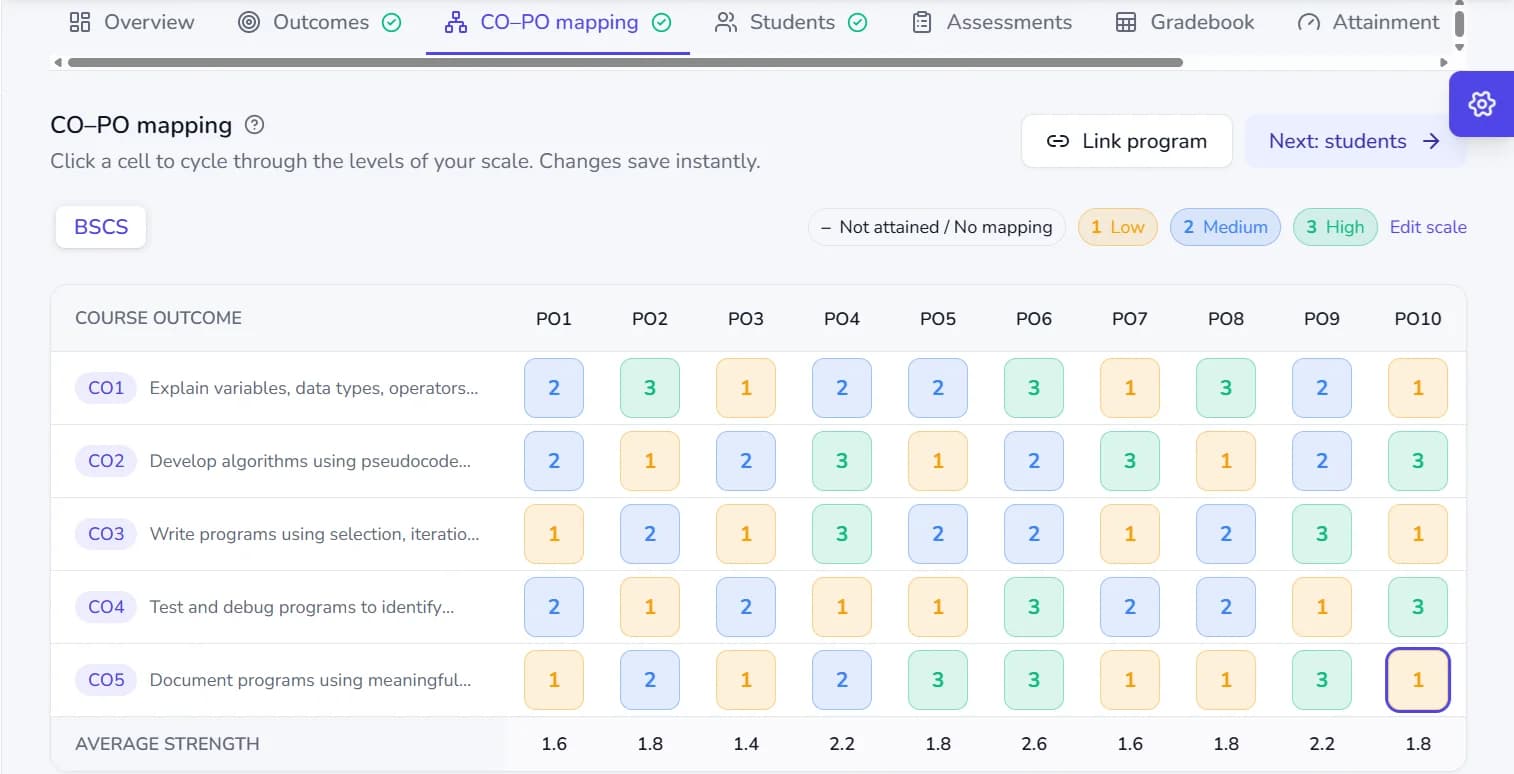
The CO–PO matrix: click a cell to cycle through your scale. - 3Step 3 of 8
Bring in your students
One roster, any mix of programs and sections.
Upload an Excel list or add students one by one. Learners in the same course can come from different programs, semesters and sections.
Puts into practice: Evidence for every learner
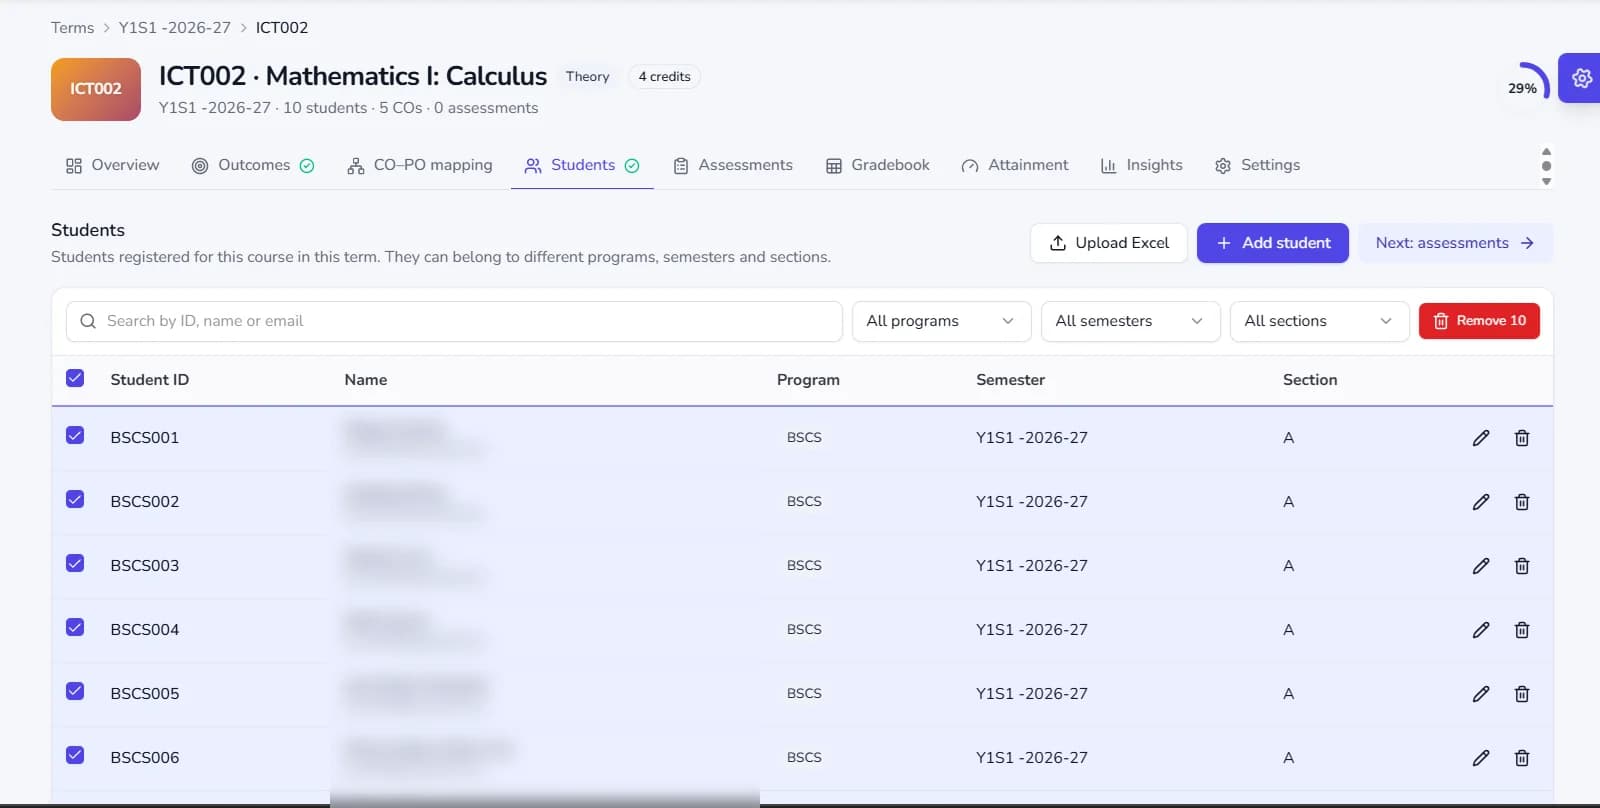
The Students tab with Upload Excel. Names are blurred here for privacy. - 4Step 4 of 8
Plan assessments against outcomes
Every task earns its place in the course.
Create quizzes, projects and exams with weightage and component, then tag the outcomes they measure, for the whole assessment or question by question, including OR and “any N” choices.
Puts into practice: Every assessment maps to an outcome
Planning assessments. Creating an assessment and tagging the course outcomes it measures. 15 seconds, no audio. - 5Step 5 of 8
Enter or upload marks
Marks in. Attainment out.
Type marks into the gradebook or upload them from Excel, mark absentees, and process CO attainment for each assessment as soon as marks are in.
Puts into practice: Assessed work as evidence
Entering marks. Entering marks in the gradebook, with Excel upload, then processing CO attainment for the assessment. 10 seconds, no audio. - 6Step 6 of 8
Set thresholds, targets and scales
One rule, applied the same way to every course.
Give each CO a threshold and a target, choose the attainment scale your institution uses, and optionally blend a course exit survey as indirect evidence.
Puts into practice: Transparent, consistent attainment
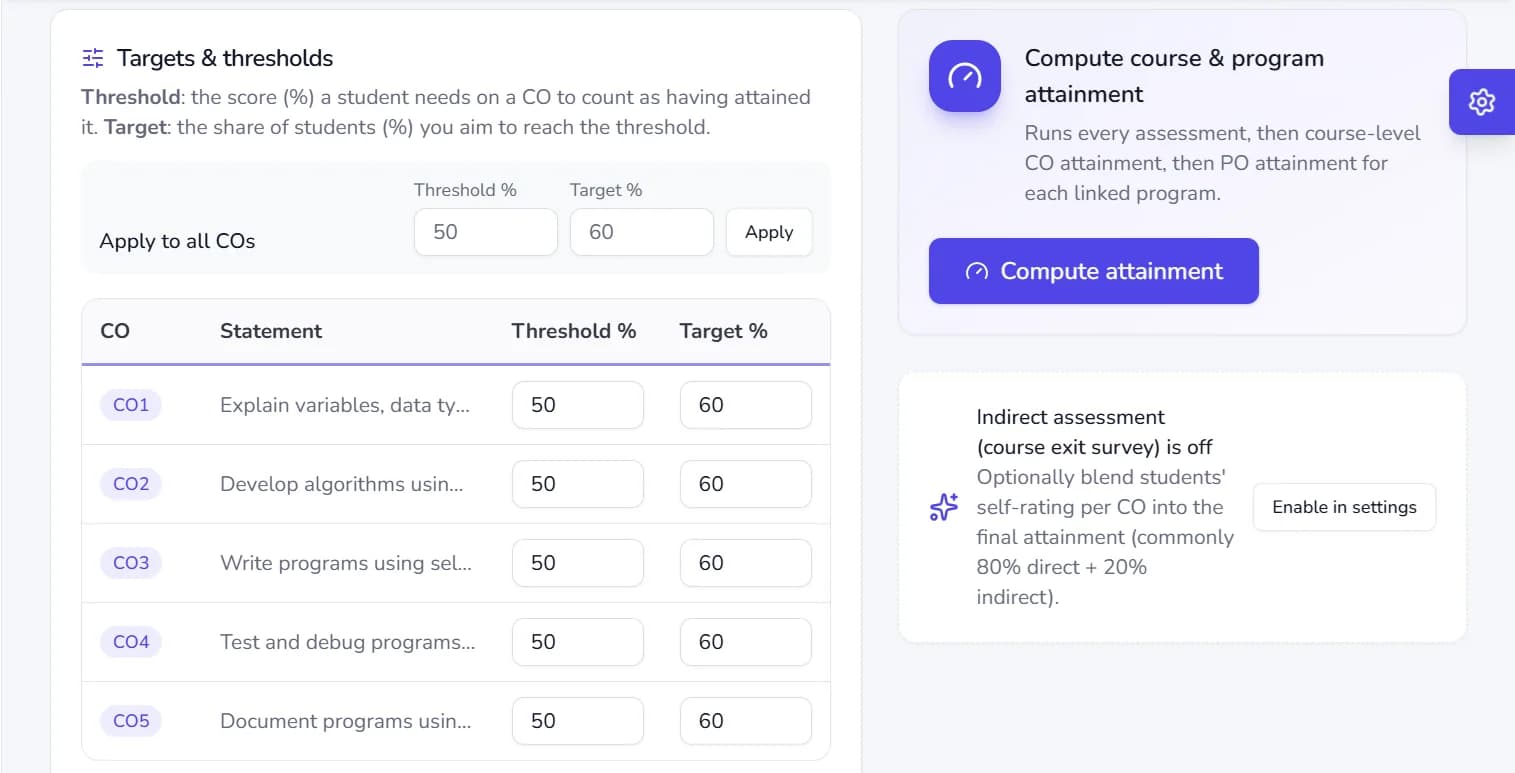
Targets and thresholds per CO, with Compute attainment. - 7Step 7 of 8
See gaps and at-risk students
Find the gap before the term ends.
Compare each outcome’s attainment with its target, see at-risk students and get prioritised items that need attention.
Puts into practice: CMO 46’s culture of improvement
Reviewing outcome insights. Comparing course outcome attainment with targets and checking items that need attention. 31 seconds, no audio. - 8Step 8 of 8
Generate the course file
The evidence record, assembled for you.
Produce a course file with outcomes, CO–PO mapping, the assessment plan, attainment methodology, CO and PO attainment and space for observations and an action plan.
Puts into practice: A connected evidence record
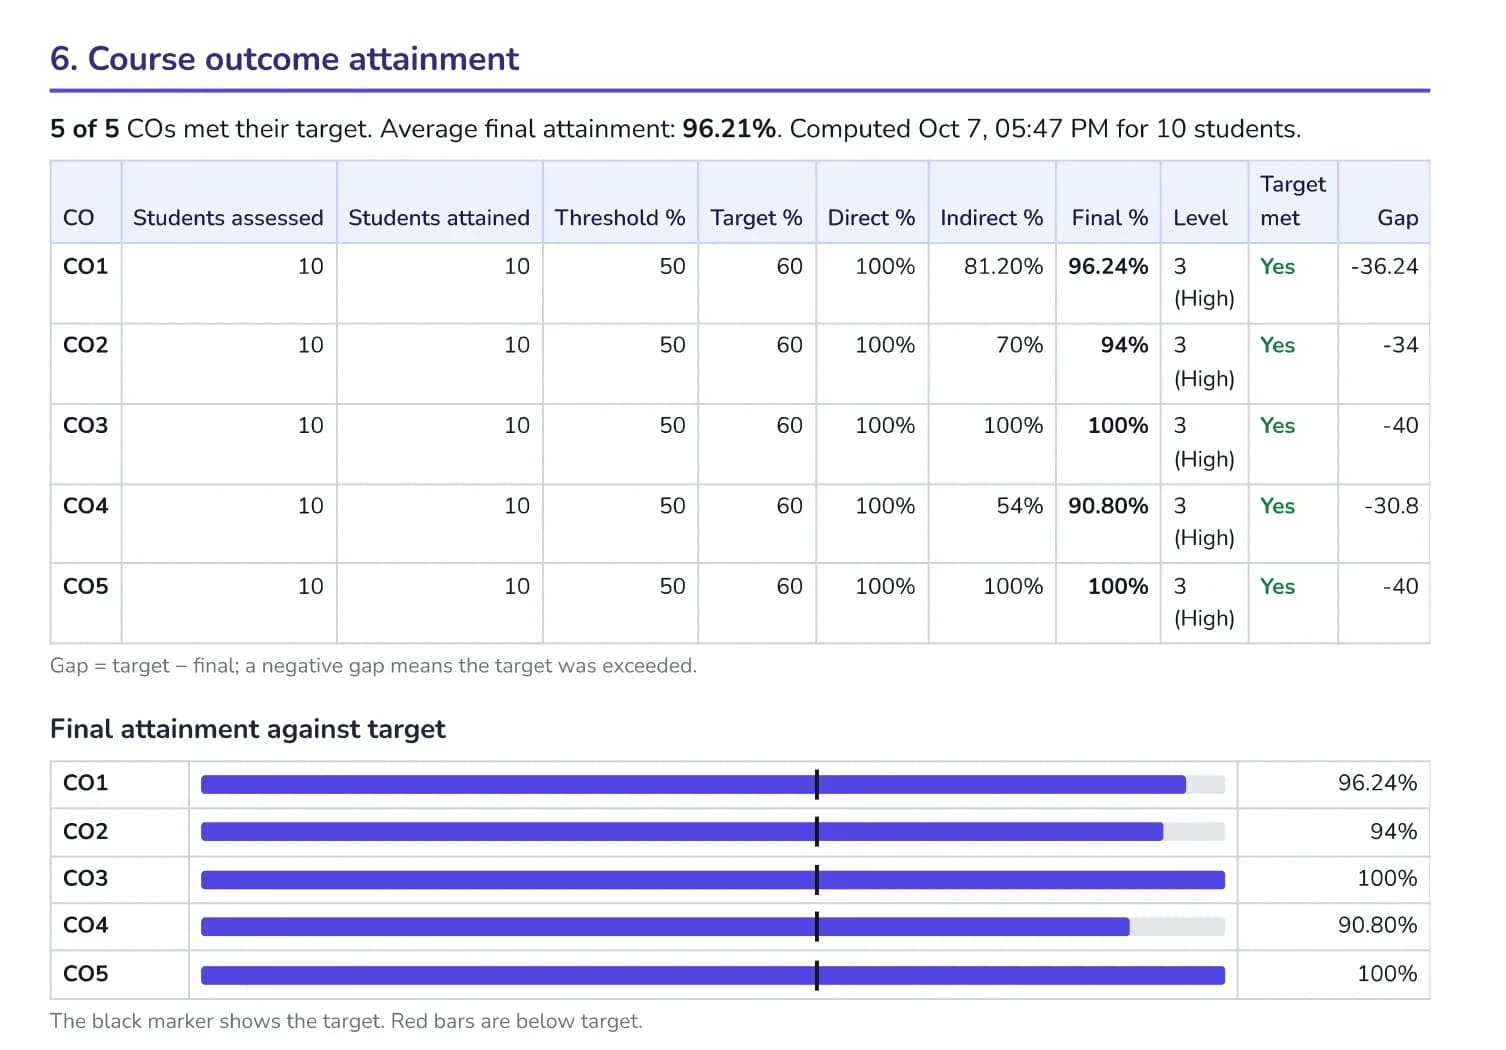
From a sample course file: CO attainment against target.
Built for the CHED framework
The outcome chain you know, mapped to the screens you use.
- Program outcomes & graduate attributesPrograms & POs
- Course outcomes (CLOs)Outcomes tab, with Bloom’s levels
- CO–PO alignmentCO–PO mapping matrix
- Assessments tagged to outcomesAssessments + Gradebook
- Attainment and improvementAttainment, Insights and the course file
See the detail behind every number
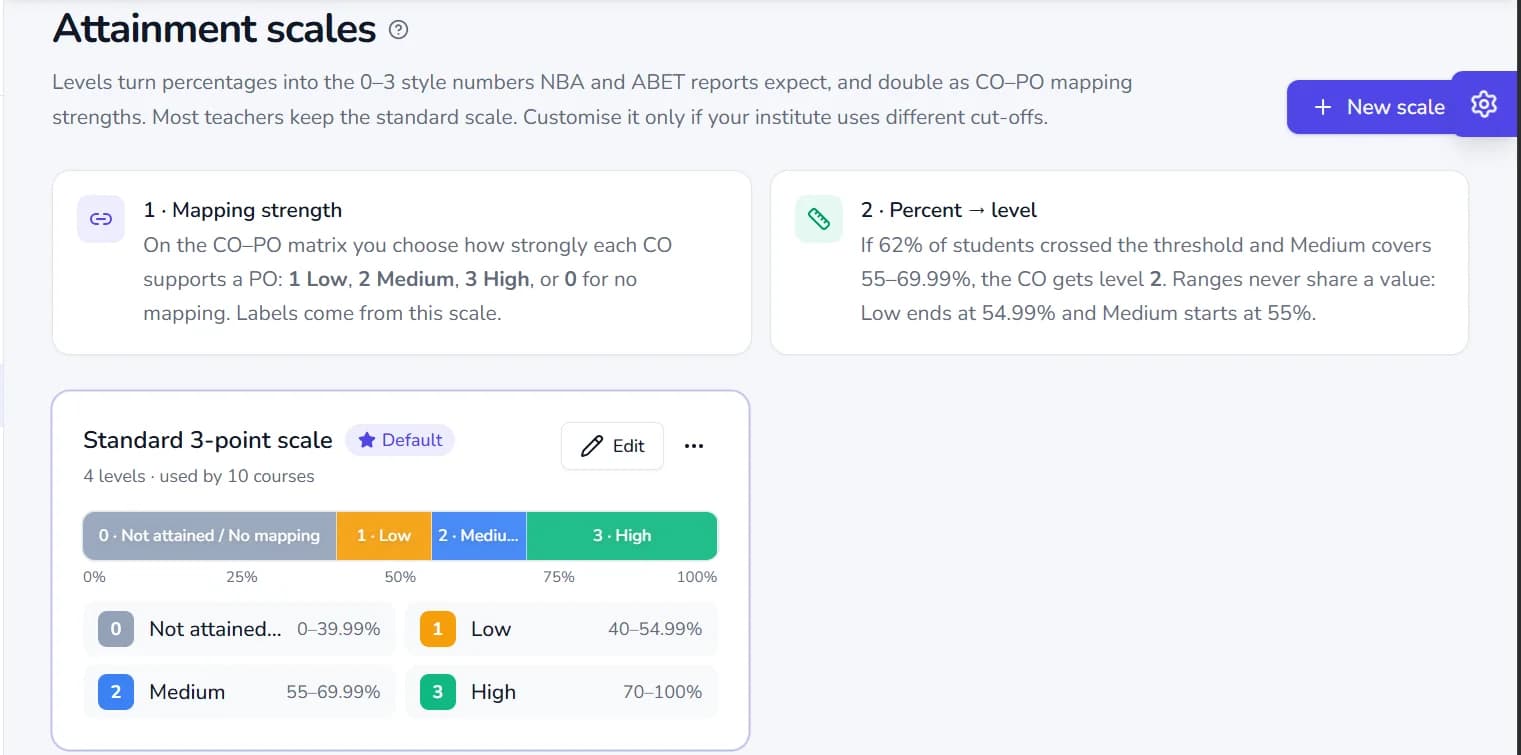
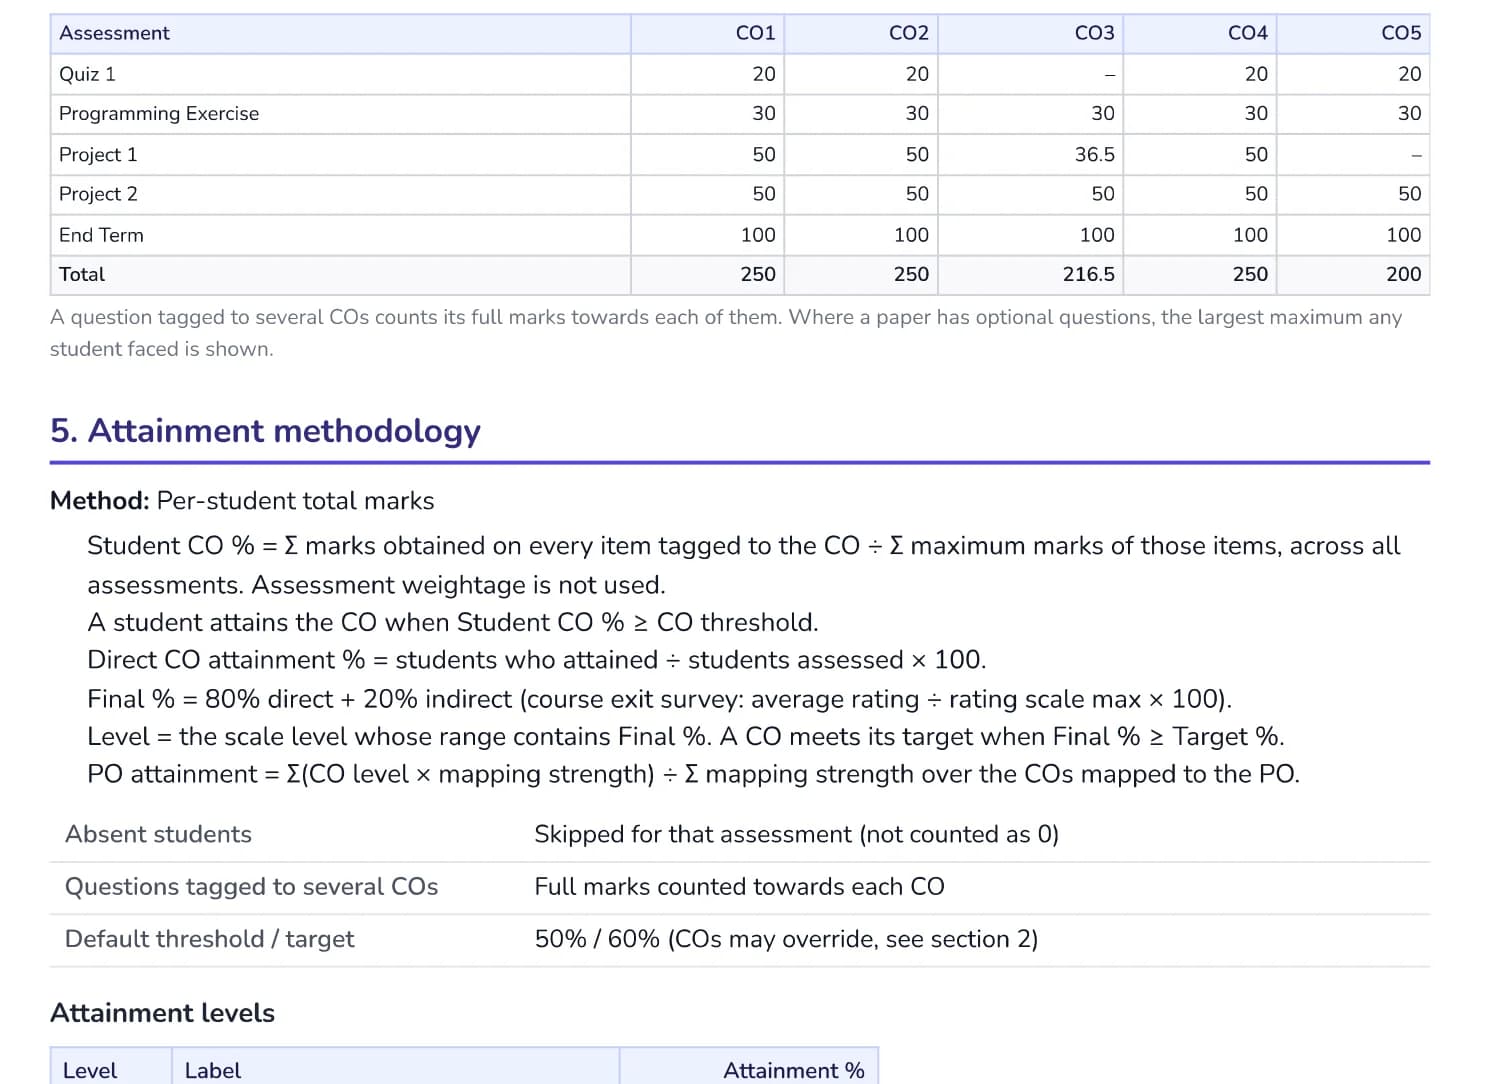
Free access to OBE Studio
Start measuring outcomes today, free.
Plan, measure and report learning outcomes in one guided workspace, without the spreadsheets, following the same chain CHED describes, from program outcomes to course outcomes to every assessment.
- Step 1Sign up freeCreate your OBE Studio account in minutes.
- Step 2Add a courseEnter or paste its course outcomes and link your program.
- Step 3See attainmentMap, assess, enter marks: CO and PO attainment follow.
Free account · Works in your browser