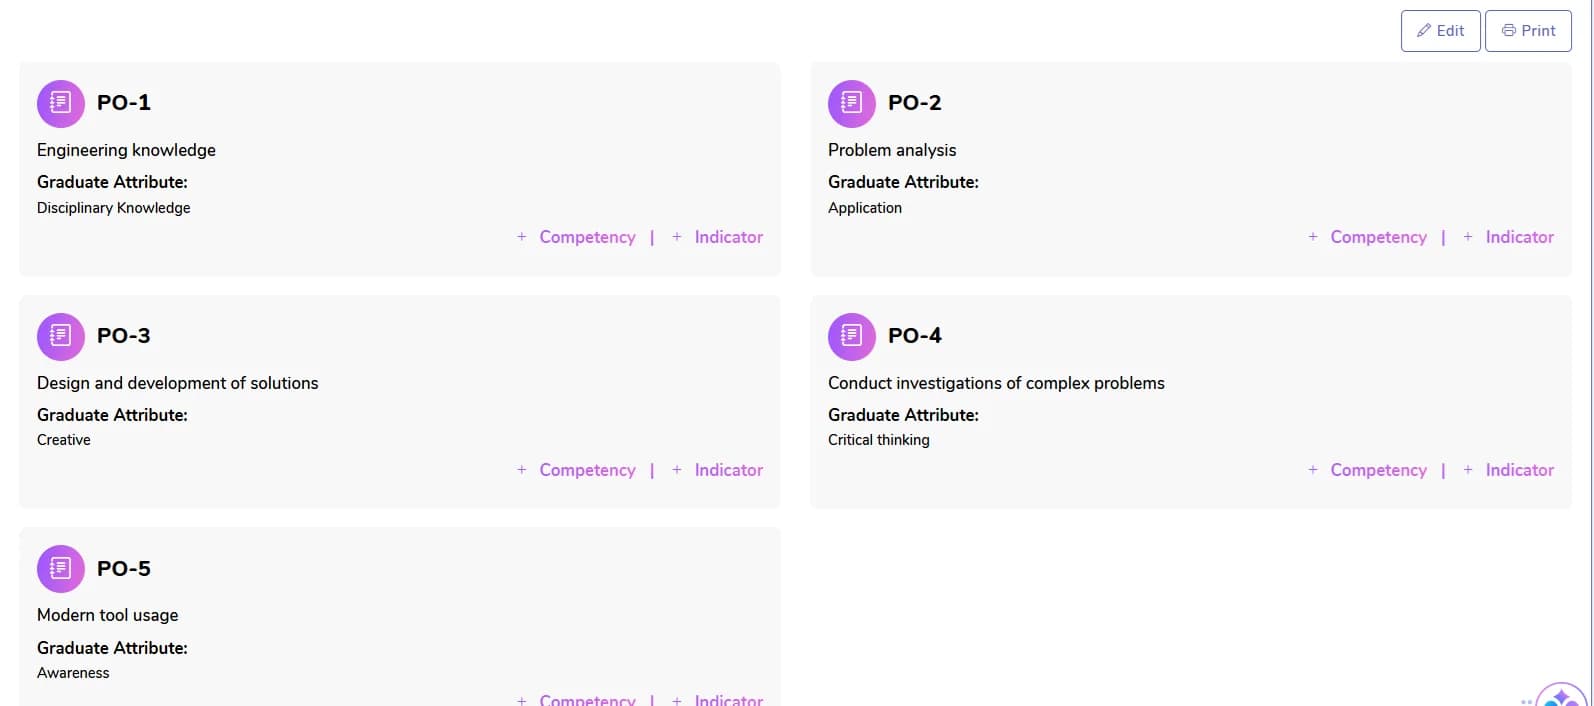
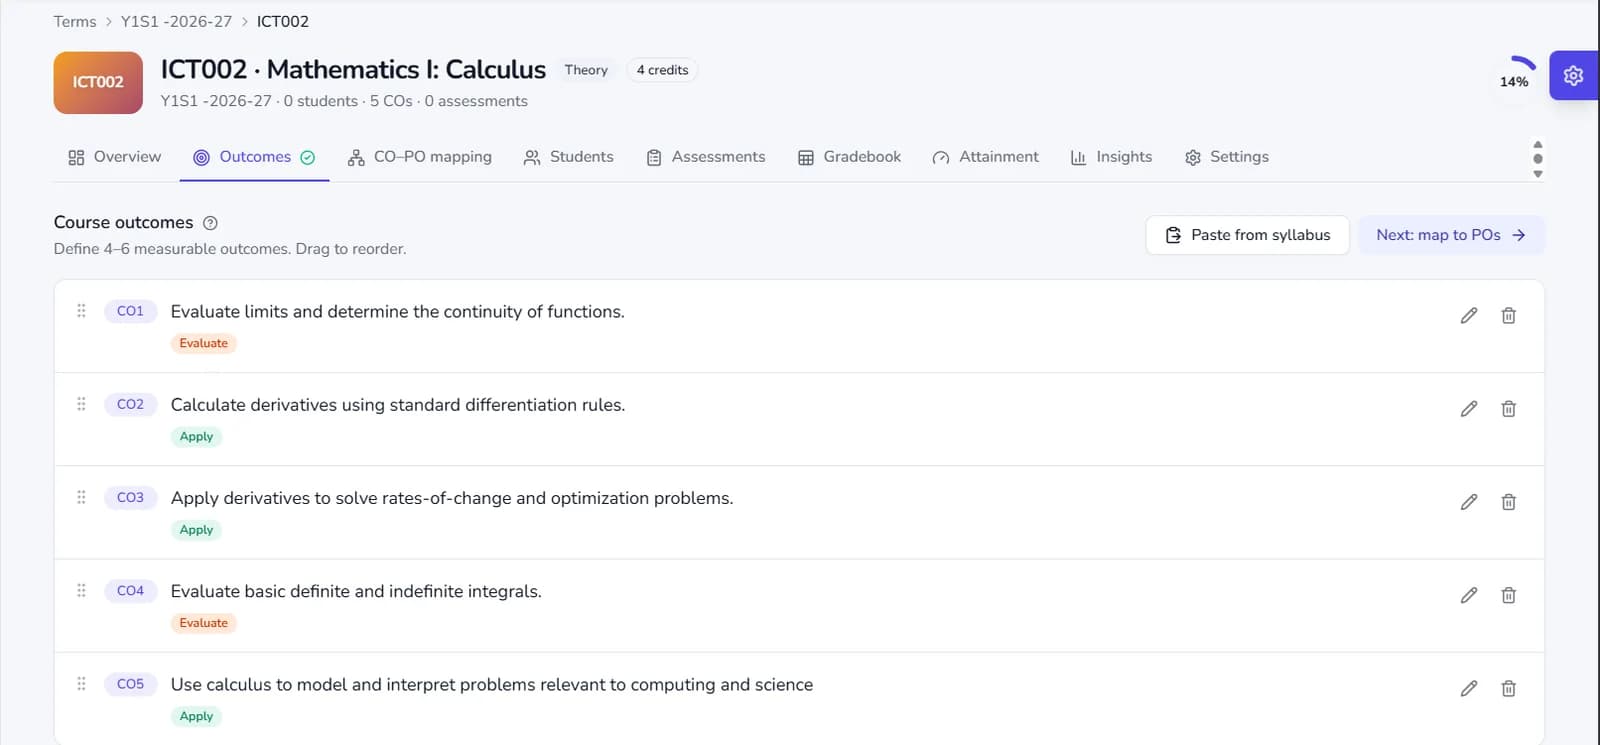
Assessment provides evidence against an agreed standard; evaluation interprets that evidence and decides what to change. Attainment is the bridge between the two: it turns marks on assessed work into a clear answer to “did learners achieve this outcome?”
Two words to agree on first
- Threshold: the score a student needs on a course outcome to count as having attained it.
- Target: the share of students you aim to reach that threshold.
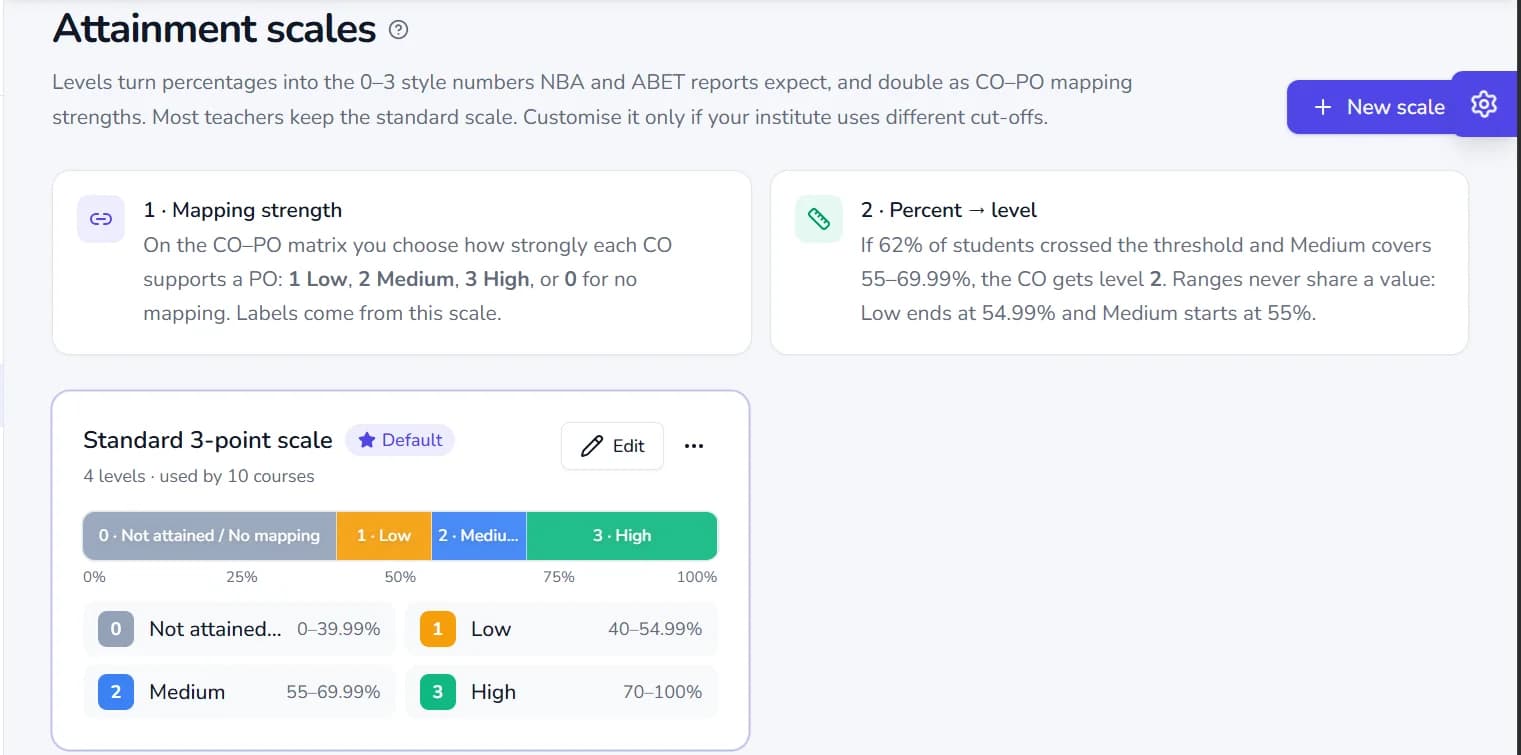
The share of students who reach the threshold becomes the CO’s attainment percentage. A scale then converts the percentage into a level (for example 0 to 3), which can be compared across courses and rolled up to program outcomes.
The method, step by step
This is the method used in OBE Studio’s sample course file. It is illustrative; use your institution’s approved policy for real decisions.
- Student CO % = marks obtained on every item tagged to the CO ÷ maximum marks of those items, across all assessments.
- A student attains the CO when Student CO % ≥ CO threshold.
- Direct CO attainment % = students attained ÷ students assessed × 100.
- Final % = 80% direct + 20% indirect (course exit survey: average rating ÷ rating scale maximum × 100).
- Level = the scale level whose range contains Final %. The CO meets its target when Final % ≥ Target %.
- PO attainment = Σ(CO level × mapping strength) ÷ Σ mapping strength over the COs mapped to the PO.
Direct and indirect evidence
Direct evidence (exams, projects, lab reports, presentations and portfolios scored against criteria) carries most of the weight. Indirect evidence such as course exit surveys and alumni or employer feedback adds context; in many methods it is blended in with a smaller weight, as in step 4 above.
Locate the gap before choosing the fix
Compare each outcome with its target, then look across courses and cohorts for patterns. If learners calculate accurately but struggle to justify a decision, an annotated exemplar and a feedback clinic, followed by a comparable task, show whether the change helped.
Try the numbers yourself in the interactive attainment example, or read the full guide to assessment and closing the loop.